JENRIX Technology Engineering
DASHBOARDS / PORTALS / BUSINESS VISIBILITY

Visibility engineered for decisions and action.

Jenrix designs dashboards and portals that connect business data, workflow context, user access, KPIs and decision support into one structured visibility layer.

Whether the user is a founder, manager, employee, customer, partner or administrator, the interface should expose the right information, actions and business context for that role.

KPI VISIBILITY ROLE-BASED ACCESS WORKFLOW CONTEXT DECISION SUPPORT
JENRIX / VISIBILITY OPERATING LAYER Business Intelligence & Portal Control System
VISIBILITY LAYER LIVE
DATA SOURCES08 CONNECTED
USERS214 ACTIVE
KPIsLIVE
ACCESSROLE BASED
ALERTSMONITORED
01 / DATA Connected Sources CRM / ERP / APIs / Databases
02 / MODEL Metrics & Business Logic KPIs / Filters / Aggregation
03 / EXPERIENCE Dashboard & Portal Views Executive / Team / Customer
04 / ACTION Decisions & Workflow Alerts / Tasks / Next Actions
ROLE ACCESS Identity & Permissions Admin / Manager / Customer / Partner
INSIGHT Signals & Exceptions Trends / Thresholds / Priority
JENRIX CORE VISIBILITY DATA / EXPERIENCE / CONTROL
LIVE SIGNAL KPI DATA SYNCHRONISED
DATACONNECTED
ACCESSCONTROLLED
REPORTINGLIVE
WORKFLOWCONTEXTUAL
DECISIONSSUPPORTED
VISIBILITY SYSTEM 01

A dashboard should explain what deserves attention.

A portal should go further — giving each user the right combination of information, records, actions, workflow context and access according to their role.

INPUTConnected Data
LOGICKPIs & Rules
EXPERIENCERole-Based Views
OUTCOMEDecision Clarity

Displaying information is not the same as creating visibility.

Dashboards fail when metrics are detached from business context, while portals fail when they expose records without structuring access, actions, decisions and user journeys around them.

DECORATIVE REPORTING

More charts, but no clearer operating picture.

  • KPIs are displayed without decision context
  • Users still ask where to act next
  • Data exists across several disconnected systems
  • Different users see the same generic interface
  • Dashboards become passive reporting screens
JENRIX VISIBILITY SYSTEM

Data, access and workflow context designed together.

  • Metrics align to roles, decisions and outcomes
  • Alerts and exceptions make priorities visible
  • Connected systems feed one structured layer
  • Views adapt to user type and permissions
  • Portals support actions as well as observation

One visibility layer. Multiple user experiences.

Jenrix combines reporting, access logic, workflow context, user actions and intelligence so dashboards and portals become useful interfaces for how the business actually operates.

01EXECUTIVE

Executive KPI Dashboards

Revenue, operations, performance, trends, forecasts, targets and management-level business visibility.

02OPERATIONS

Operational Dashboards

Queues, pending work, approvals, workload, status movement, SLA monitoring and execution visibility.

03CUSTOMER

Customer Portals

Authenticated access to records, updates, service status, documents, requests and account-level information.

04ADMIN

Admin & Control Portals

User management, permissions, monitoring, approvals, configuration, records and system-level oversight.

05ACCESS

Role-Based Views

Different data, actions and visibility for leaders, teams, customers, vendors, partners and administrators.

06REPORTING

Business Intelligence Interfaces

Connected metrics, trends, filters, comparisons and structured analytical views across business data.

07ALERTS

Exceptions & Priority Signals

Thresholds, warnings, missed actions, unusual patterns, bottlenecks and decision-oriented attention layers.

08AI

AI-Assisted Insight Layers

Summaries, anomaly detection, natural-language explanations, recommendations and decision-support intelligence.

Use visuals to support the system, not replace the architecture.

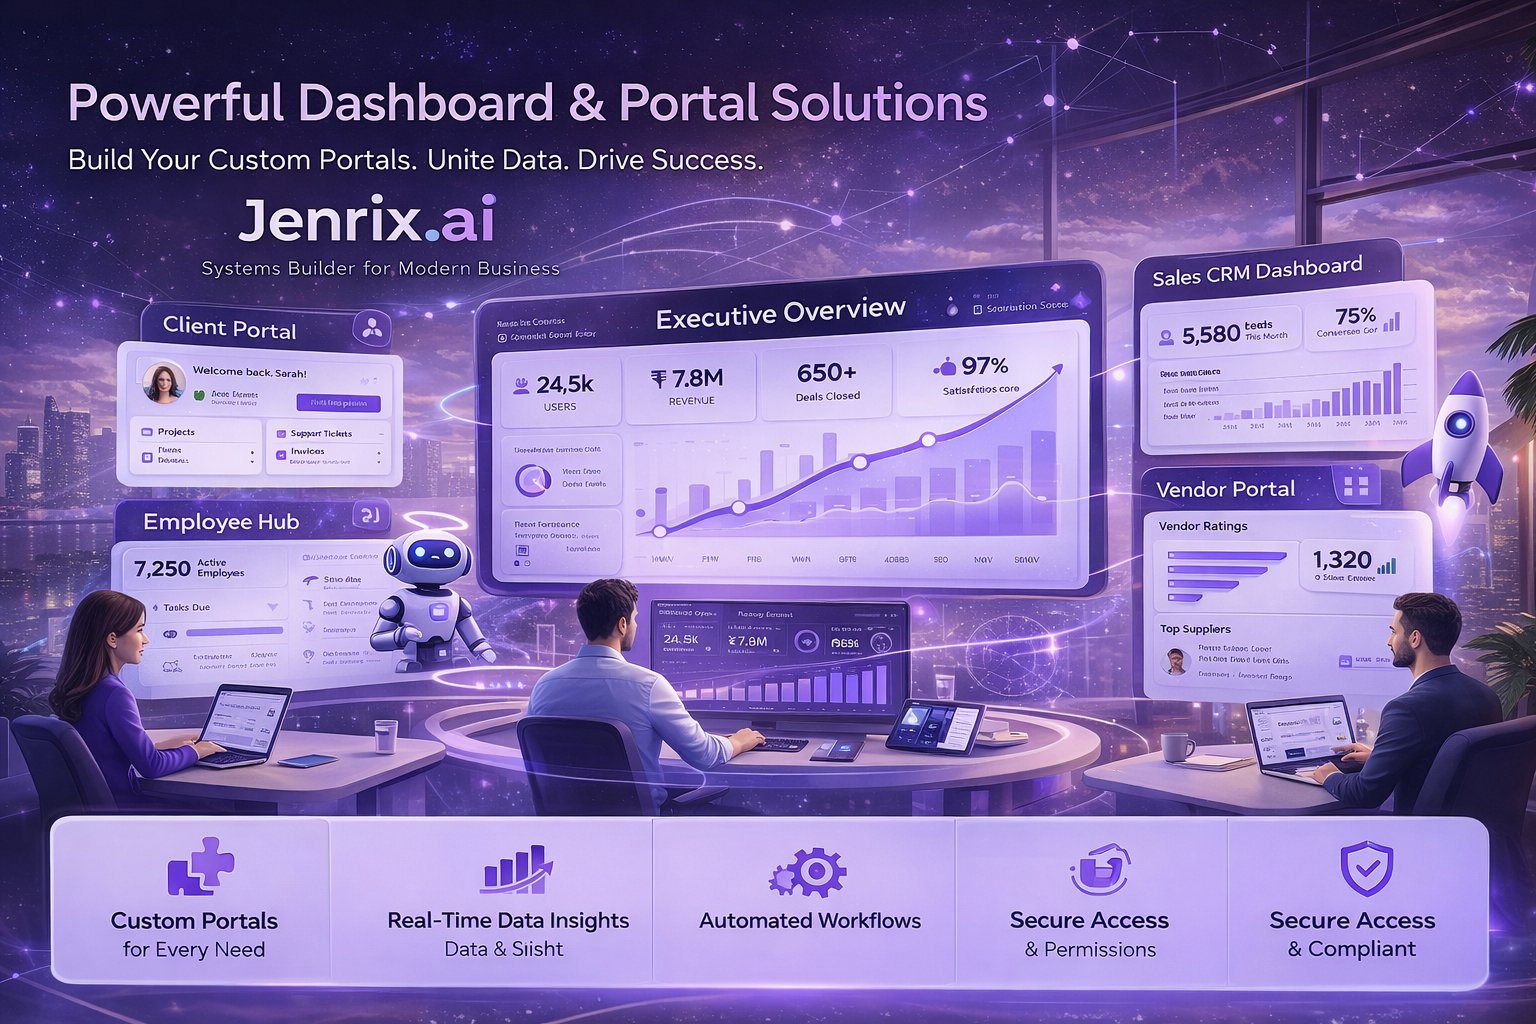
Your existing dashboard image is retained as a supporting reference while the live architecture above communicates the operating logic of the visibility system.

JENRIX / DASHBOARD & PORTAL REFERENCE
VISIBILITY LAYER CONNECTED
Jenrix dashboard and portal interface with KPI visibility, operational reporting and role-based user access

Different users require different visibility architecture.

A useful dashboard or portal begins by identifying who needs visibility, what they are responsible for, which decisions they make and which actions they should be able to take.

01 / LEADERSHIP

Executive Decision Dashboards

For founders and leadership teams needing concise KPI visibility, business summaries and operational health signals.

02 / TEAMS

Team Operations Dashboards

For teams managing queues, tasks, approvals, requests, escalations and day-to-day accountability.

03 / CUSTOMER

Customer Self-Service Portals

For customers accessing records, updates, documents, service status, requests and account information.

04 / ADMIN

Admin & Control Portals

For administrators managing users, permissions, records, workflows, configuration and system oversight.

05 / PARTNER

Partner & Vendor Portals

For external stakeholders requiring controlled access to shared data, tasks, progress and account workflows.

06 / ANALYTICS

Business Intelligence Interfaces

For organizations converting connected data into trends, comparisons, management signals and analytical decision support.

Useful interfaces align data, access, context and decisions.

Strong dashboards and portals sit on top of connected systems and translate complex information into role-specific visibility, actions, operational context and decision support.

01DATAConnected Sources

CRM, ERP, applications, databases, APIs, events and analytics.

02LOGICMetrics & Business Rules

KPIs, calculations, thresholds, filters and business definitions.

03ACCESSRoles & Permissions

Who can see, edit, approve, download, act or manage information.

04EXPERIENCEDashboard & Portal Views

Executive, operational, customer, partner and administration interfaces.

05INTELLIGENCESignals & Decision Support

Alerts, exceptions, trends, priorities, summaries and AI-assisted insight.

Questions businesses ask before building visibility systems.

Practical answers for leaders, operations teams and product owners evaluating custom dashboards and portals.

What is the difference between a dashboard and a portal?+

A dashboard primarily presents operational or analytical visibility. A portal combines visibility with authenticated access, role-based actions, records, workflows and self-service experiences.

Can Jenrix build role-based dashboards and portals?+

Yes. Jenrix can design different views, permissions, actions and data exposure for executives, managers, teams, customers, vendors, partners and administrators.

Can dashboards connect with CRM, ERP and operational systems?+

Yes. Dashboards and portals can integrate with CRM, ERP, internal applications, APIs, databases, analytics systems and external services to provide a unified visibility layer.

Can AI be added to dashboards and portals?+

Yes. AI can support summaries, anomaly detection, natural-language explanations, recommendations, classification and decision-support features when the underlying data and workflow context are reliable.

BUILD THE VISIBILITY LAYER

If business visibility matters, the interface should help people act.

Jenrix can map your users, decisions, data sources and workflows, then engineer a dashboard or portal around the way your business actually needs to monitor, understand and act.

PROJECT ENQUIRY Discuss Your Requirement